
Case study: KPI reporting and dashboards
KPI dashboard for production, cost and sales tracking
Production, cost and sales data consolidated from spreadsheets into one dashboard with live KPI views.
Overview
An operations business needed help with this: production, cost and sales data consolidated from spreadsheets into one dashboard with live KPI views.
The problem
The client faced difficulties in efficiently tracking KPIs across production, costs, and sales due to reliance on manual processes and spreadsheets, impeding timely decision-making.
- Data Integration: Multiple data sources lacked cohesion.
- Manual Reporting: Time-consuming and prone to errors.
- Scalability: Existing system couldn’t handle growing data.
- Real-time Insights: Delayed data processing hindered decisions.
- Performance Monitoring: Inefficient tracking of KPIs.
- Cost Analysis: Difficulty in identifying cost inefficiencies.
- Sales Performance: Incomplete view of sales metrics.
- User Adoption: Resistance to new technology implementation.
What we built
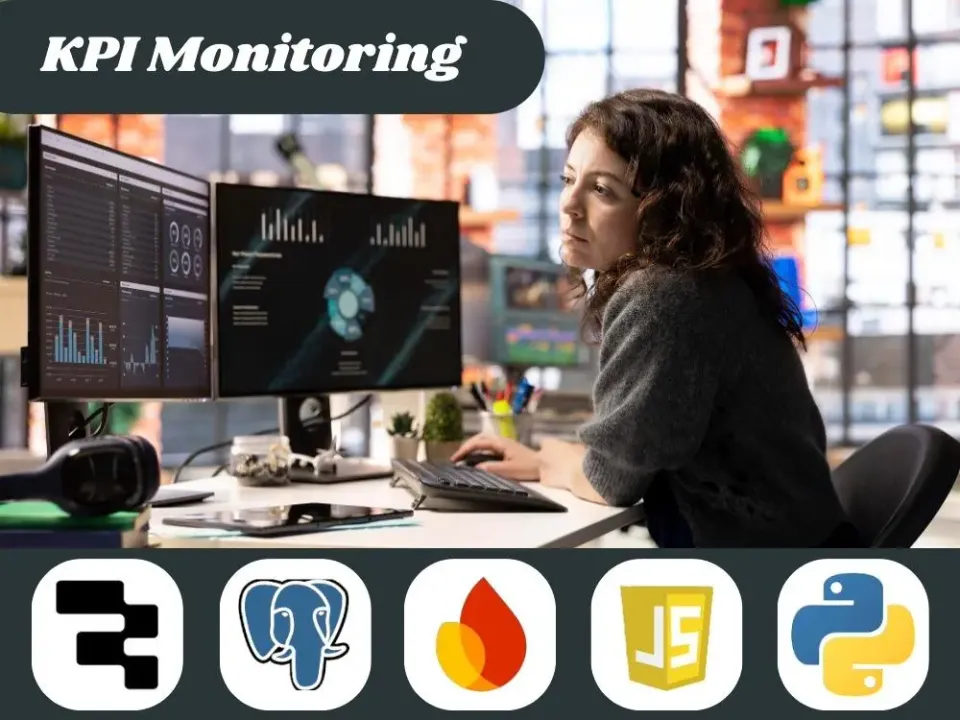
The solution involved creating an analytical dashboard that consolidates diverse datasets into a single platform, offering real-time insights and facilitating swift, informed decisions by highlighting key performance trends and inefficiencies.
- Data Consolidation: Integrated various data sources into a unified view.
- Real-time Processing: Enabled instant access to up-to-date information.
- KPI Visualization: Simplified complex data into intuitive charts.
- Automated Reporting: Eliminated manual report generation.
- Scalable Framework: Designed for future data and KPI integration.
- User-Friendly Interface: Ensured ease of use for all stakeholders.
- Performance Alerts: Set up notifications for critical KPI changes.
- Sales Trend Analysis: Provided comprehensive sales metric insights.
How it works
The system runs on the tools listed below. Platform names appear here and in the stack, so you can see exactly what was used.
- Frontend: Retool, custom UI components
- Backend: AWS, PostgreSQL
- Data Processing: Python
- Visualization: D3.js
- Design: Figma
Result
- Reduced manual reporting time
- Improved sales performance tracking
- Enhanced productivity gap identification
- Established a scalable analytics framework
Related
This project is an example of kpi reporting and dashboards. If your team has a similar workflow, the pages below explain how we approach it, and the neighbouring case studies show the same ideas in other businesses.